- 您現(xiàn)在的位置:買賣IC網(wǎng) > PDF目錄375230 > AD1893 (Analog Devices, Inc.) Low Cost SamplePort 16-Bit Stereo Asynchronous Sample Rate Converter(低成本采樣端口16位立體聲異步采樣率轉(zhuǎn)換器) PDF資料下載
參數(shù)資料
| 型號: | AD1893 |
| 廠商: | Analog Devices, Inc. |
| 英文描述: | Low Cost SamplePort 16-Bit Stereo Asynchronous Sample Rate Converter(低成本采樣端口16位立體聲異步采樣率轉(zhuǎn)換器) |
| 中文描述: | 低成本SamplePort 16位立體聲異步采樣率轉(zhuǎn)換器(低成本采樣端口16位立體聲異步采樣率轉(zhuǎn)換器) |
| 文件頁數(shù): | 12/20頁 |
| 文件大小: | 338K |
| 代理商: | AD1893 |
AD1893
–12–
REV. 0
Cutoff Frequency Modification
The final important operating concept of the ASRC is the
modification of the filter cutoff frequency when the output
sample rate (F
SOUT
) drops below the input sample rate
(F
SIN
),i.e., during downsampling operation. The AD1893 auto-
matically reduces the polyphase filter cutoff frequency under
this condition. This lowering of the cutoff frequency (i.e., the
reduction of the input signal bandwidth) is required to avoid
alias distortion. The AD1893 SamplePort takes advantage of the
scaling property of the Fourier transform which can be stated as
follows: if the Fourier transform of f(t) is F(w), then the Fourier
transform of f(k
×
t) is F(w/k). This property can be used to
linearly compress the frequency response of the filter, simply by
multiplying the coefficient ROM addresses (shown in Figure 6)
by the ratio of F
SOUT
to F
SIN
whenever F
SOUT
is less than F
SIN
.
This scaling property works without spectral distortion because
the time scale of the interpolated signal is so dense (300 ps
resolution) with respect to the cutoff frequency that the
discrete-time representation is a close approximation to the
continuous time function.
The cutoff frequency (–3 dB down) of the FIR filter during
downsampling is given by the following relation:
Downsampling Cutoff Frequency = (F
SOUT
/44.1 kHz)
×
20 kHz
The AD1893 frequency response compression circuit includes a
first order low-pass filter to smooth the filter cutoff frequency
selection during dynamic sample rate conditions. This allows
the ASRC to avoid objectionable clicking sounds that would
otherwise be imposed on the output while the loop settles to a
new sample rate ratio. Hysteresis is also applied to the filter
selection with approximately 300 Hz of cutoff frequency “noise
margin,” which limits the available selection of cutoff frequen-
cies to those falling on an approximately 300 Hz frequency grid.
Thus if a particular sample frequency ratio was reached by
sliding the output sample frequency up, it is possible that a filter
will be chosen with a cutoff frequency that could differ by as
much as 300 Hz from the filter chosen when the same sample
frequency ratio was reached by sliding the output sample
frequency down. This is necessary to ensure that the filter
selection is stable even with severely jittered input sample
clocks.
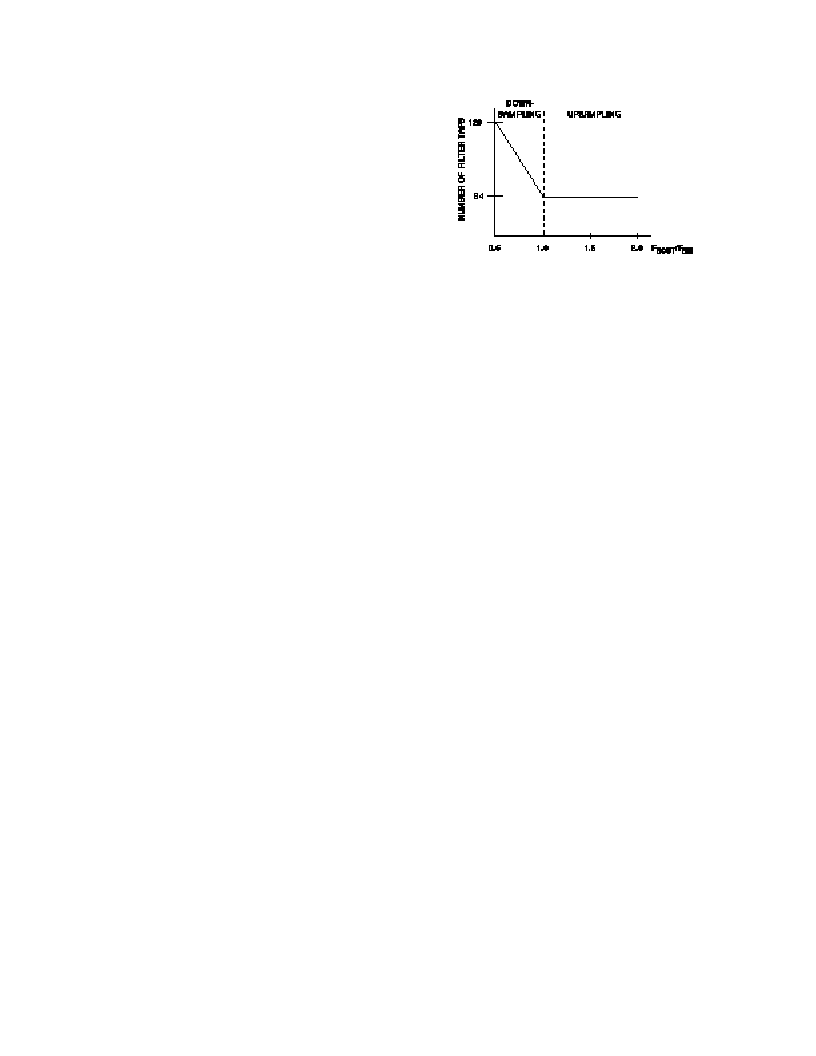
Note that when the filter cutoff frequency is reduced, the
transition band of the filter becomes narrower since the scaling
property affects all filter characteristics. The number of FIR
filter taps necessarily increases because there are now a smaller
number of longer length polyphase filters. Nominally, when
F
SOUT
is greater than F
SIN
, the number of taps is 64. When
F
SOUT
is less than F
SIN
, the number of taps linearly increase to a
maximum of 128 when the ratio of F
SOUT
to F
SIN
equals 1:2.
The number of filter taps as a function of sample clock ratio is
illustrated in Figure 8. The natural consequence of this increase
in filter taps is an increase in group delay.
Figure 8. Number of Filter Taps as a Function of
F
SOUT
/F
SlN
When the AD1893 output sample frequency is higher than the
input sample frequency (i.e., upsampling operation), the cutoff
frequency of the FIR polyphase filter can be greater than 20kHz.
The cutoff frequency of the FIR filter during upsampling is
given by the following relation:
Upsampling Cutoff Frequency = (F
SIN
/
44.1
kHz)
×
20
kHz
Noise and Distortion Phenomena
There are three noise/distortion phenomena that limit the
performance of the AD1893 ASRC. First, there is broadband,
Gaussian noise which results from polyphase filter selection
quantization. Even though the AD1893 has a large number of
polyphase filters (the equivalent of 65,536) to choose from, the
selection is not infinite. Second, there is narrow-band noise
which results from the nonideal synchronization of the sample
clocks to the 16 MHz system clock, which leads to a nonideal
computation of the sample clock ratio, which leads to a nonideal
polyphase filter selection. This noise source is narrowband
because the digital servo control loop averages the polyphase
filter selection, leading to a strong correlation between selections
from output to output. In slow mode, the selection of polyphase
filters is completely unaffected by the clock synchronization. In
fast mode, some narrowband noise modulation may be observed
with very long FFT measurements. This situation is analogous
to the behavior of a phase locked loop when presented with a
noisy or jittered input. Third, there are distortion components
that are due to the noninfinite stopband rejection of the
low-pass filter response. Noninfinite stopband rejection means
that some amount of out-of-band spectral energy will alias into
the baseband. The AD1893 performance specifications include
the effects of these phenomena.
Note that Figures 16 through 18 are shown with full-scale input
signals. The distortion and noise components will scale with the
input signal amplitude. In other words, if the input signal is
attenuated by –20 dB, the distortion and noise components will
also be attenuated by –20 dB. This dependency holds until the
effects of the 16-bit input quantization are reached.
相關(guān)PDF資料 |
PDF描述 |
|---|---|
| AD1895 | 3 V/5 V Digital Audio Receiver,External APLL(數(shù)字音頻接收器) |
| AD1970 | Digital BTSC Encoder with Integrated ADC and DAC |
| AD1970JSTZ | Digital BTSC Encoder with Integrated ADC and DAC |
| AD1970JSTZRL | Digital BTSC Encoder with Integrated ADC and DAC |
| AD1981BLJST | AC 97 SoundMAX Codec |
相關(guān)代理商/技術(shù)參數(shù) |
參數(shù)描述 |
|---|---|
| AD1893JN | 制造商:Analog Devices 功能描述:Sample Rate Converter 28-Pin PDIP W 制造商:Rochester Electronics LLC 功能描述:LOW COST ASRC PDIP 28-PIN - Bulk |
| AD1893JNZ | 制造商:Analog Devices 功能描述:Sample Rate Converter 28-Pin PDIP W |
| AD1893JST | 制造商:Analog Devices 功能描述:Sample Rate Converter 44-Pin LQFP 制造商:Rochester Electronics LLC 功能描述:LOW COST ASRC 44-PIN TQFP - Tape and Reel 制造商:Analog Devices 功能描述:IC ASR CONVERTER 16 BIT |
| AD1893JSTZ | 功能描述:IC SAMPLE-RATE CONV 16BIT 44TQFP RoHS:是 類別:集成電路 (IC) >> 線性 - 音頻處理 系列:SamplePort™ 其它有關(guān)文件:STA321 View All Specifications 標準包裝:1 系列:Sound Terminal™ 類型:音頻處理器 應(yīng)用:數(shù)字音頻 安裝類型:表面貼裝 封裝/外殼:64-LQFP 裸露焊盤 供應(yīng)商設(shè)備封裝:64-LQFP EP(10x10) 包裝:Digi-Reel® 其它名稱:497-11050-6 |
| AD1893JSTZRL | 功能描述:IC SAMPLE-RATE CONV 16BIT 44TQFP RoHS:是 類別:集成電路 (IC) >> 線性 - 音頻處理 系列:SamplePort™ 其它有關(guān)文件:STA321 View All Specifications 標準包裝:1 系列:Sound Terminal™ 類型:音頻處理器 應(yīng)用:數(shù)字音頻 安裝類型:表面貼裝 封裝/外殼:64-LQFP 裸露焊盤 供應(yīng)商設(shè)備封裝:64-LQFP EP(10x10) 包裝:Digi-Reel® 其它名稱:497-11050-6 |
發(fā)布緊急采購,3分鐘左右您將得到回復(fù)。