- 您現(xiàn)在的位置:買賣IC網(wǎng) > PDF目錄31111 > SM2T6V8A (STMICROELECTRONICS) 200 W, UNIDIRECTIONAL, SILICON, TVS DIODE, DO-216AA PDF資料下載
參數(shù)資料
| 型號(hào): | SM2T6V8A |
| 廠商: | STMICROELECTRONICS |
| 元件分類: | TVS二極管 - 瞬態(tài)電壓抑制 |
| 英文描述: | 200 W, UNIDIRECTIONAL, SILICON, TVS DIODE, DO-216AA |
| 封裝: | STMITE PACKAGE-2 |
| 文件頁數(shù): | 3/6頁 |
| 文件大小: | 51K |
| 代理商: | SM2T6V8A |

SM2T
3/6
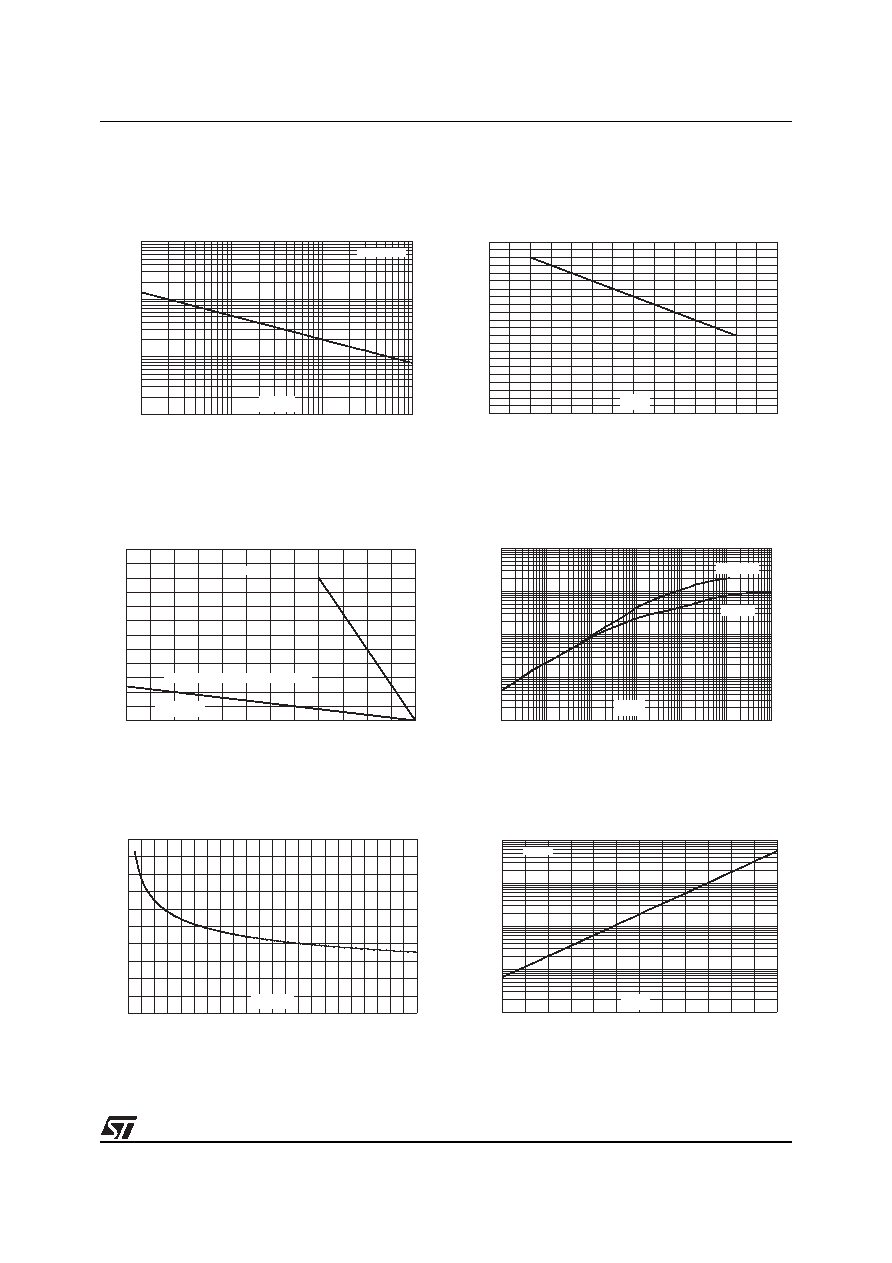
Figure 1: Peak pulse power versus exponential
pulse duration
Figure 2: Relative variation of peak pulse
power versus initial junction temperature
Figure 3: Average power dissipation versus
ambient temperature
Figure 4: Variation of thermal impedance
junction to ambient versus pulse duration
Figure 5: Thermal resistance junction to
ambient versus copper surface under tab
Figure 6: Reverse leakage current versus
junction temperature (typical values)
1.E+01
1.E+02
1.E+03
1.E+04
0.01
0.10
1.00
10.00
P
(W)
PP
t (ms)
p
T initial = 25°C
j
0
10
20
30
40
50
60
70
80
90
100
110
0
25
50
75
100
125
150
175
%
T (°C)
j
0.0
0.5
1.0
1.5
2.0
2.5
3.0
0
25
50
75
100
125
150
Printed circuit board FR4, recommended pad layout
T
(°C)
AMB
P(W)
T=
AMB
Ttab
0.1
1.0
10.0
100.0
1000.0
1.E-03
1.E-02
1.E-01
1.E+00
1.E+01
1.E+02
1.E+03
S=2cm
S=0.135cm
Z/R
th(j-c)
t (s)
p
0
50
100
150
200
250
0.0
0.2
0.4
0.6
0.8
1.0
1.2
1.4
1.6
1.8
2.0
2.2
S(cm)
R
(°C/W)
th(j-a)
1.E-02
1.E-01
1.E+00
1.E+01
1.E+02
0
25
50
75
100
125
150
T (°C)
j
I (nA)
R
V= V
RRM
相關(guān)PDF資料 |
PDF描述 |
|---|---|
| SM2T27A | 200 W, UNIDIRECTIONAL, SILICON, TVS DIODE, DO-216AA |
| SM2T14A | 200 W, UNIDIRECTIONAL, SILICON, TVS DIODE, DO-216AA |
| SM30KPA100 | 30000 W, UNIDIRECTIONAL, SILICON, TVS DIODE |
| SM30KPA220A | 30000 W, UNIDIRECTIONAL, SILICON, TVS DIODE |
| SM30KPA75CA | 30000 W, BIDIRECTIONAL, SILICON, TVS DIODE |
相關(guān)代理商/技術(shù)參數(shù) |
參數(shù)描述 |
|---|---|
| SM2-U4 | 功能描述:線性和開關(guān)式電源 250W 5V/24V DUAL OUT RoHS:否 制造商:TDK-Lambda 產(chǎn)品:Switching Supplies 開放式框架/封閉式:Enclosed 輸出功率額定值:800 W 輸入電壓:85 VAC to 265 VAC 輸出端數(shù)量:1 輸出電壓(通道 1):20 V 輸出電流(通道 1):40 A 商用/醫(yī)用: 輸出電壓(通道 2): 輸出電流(通道 2): 安裝風(fēng)格:Rack 長度: 寬度: 高度: |
| SM2-UAC-20 | 功能描述:標(biāo)準(zhǔn)LED-SMD Amber 605nm 600mcd RoHS:否 制造商:Vishay Semiconductors 封裝 / 箱體:0402 LED 大小:1 mm x 0.5 mm x 0.35 mm 照明顏色:Red 波長/色溫:631 nm 透鏡顏色/類型:Water Clear 正向電流:30 mA 正向電壓:2 V 光強(qiáng)度:54 mcd 顯示角:130 deg 系列:VLMx1500 封裝:Reel |
| SM2-UGC-20 | 制造商:Bivar 功能描述:SM2 Series 1.8mm Dome Lens Green Surface Mount LED 制造商:Bivar 功能描述:1500 PC REEL |
| SM2-UHC-20 | 制造商:Bivar 功能描述:SM2 Series 2 Leads Red Water Clear Lens 20 Viewing Angle LED 制造商:Bivar 功能描述:SURFACE MOUNT LED, HE RED, 2 MM, DOMED LENS |
| SM2-UYC-20 | 制造商:Bivar 功能描述:SM2 Series Yellow 2 mm 20 456 mcd Water Clear 2 V Dome LED Surface Mount |
發(fā)布緊急采購,3分鐘左右您將得到回復(fù)。