- 您現(xiàn)在的位置:買賣IC網(wǎng) > PDF目錄98024 > MMBF0202PLT3 (ON SEMICONDUCTOR) 300 mA, 20 V, P-CHANNEL, Si, SMALL SIGNAL, MOSFET, TO-236AB PDF資料下載
參數(shù)資料
| 型號(hào): | MMBF0202PLT3 |
| 廠商: | ON SEMICONDUCTOR |
| 元件分類: | 小信號(hào)晶體管 |
| 英文描述: | 300 mA, 20 V, P-CHANNEL, Si, SMALL SIGNAL, MOSFET, TO-236AB |
| 封裝: | PLASTIC, CASE 318-08, 3 PIN |
| 文件頁數(shù): | 25/34頁 |
| 文件大小: | 356K |
| 代理商: | MMBF0202PLT3 |
第1頁第2頁第3頁第4頁第5頁第6頁第7頁第8頁第9頁第10頁第11頁第12頁第13頁第14頁第15頁第16頁第17頁第18頁第19頁第20頁第21頁第22頁第23頁第24頁當(dāng)前第25頁第26頁第27頁第28頁第29頁第30頁第31頁第32頁第33頁第34頁
9–19
Reliability and Quality Assurance
Motorola Small–Signal Transistors, FETs and Diodes Device Data
147
148
149
150
151
152
153
154
1
2
3
4
5
6
7
8
9
10
11
12
13
14
15
16
18
19
20
21
22
23
24
25
26
27
28
29
30
31
32
33
34
35
36
37
38
39 40
41
42
43
44
45
46
47
48
49
50
51
52
53
54
55
56
57
58
59
60
61
62
63
64
65
66
67
68
69
70
71
72
73
74
75
0
1
2
3
4
5
6
7
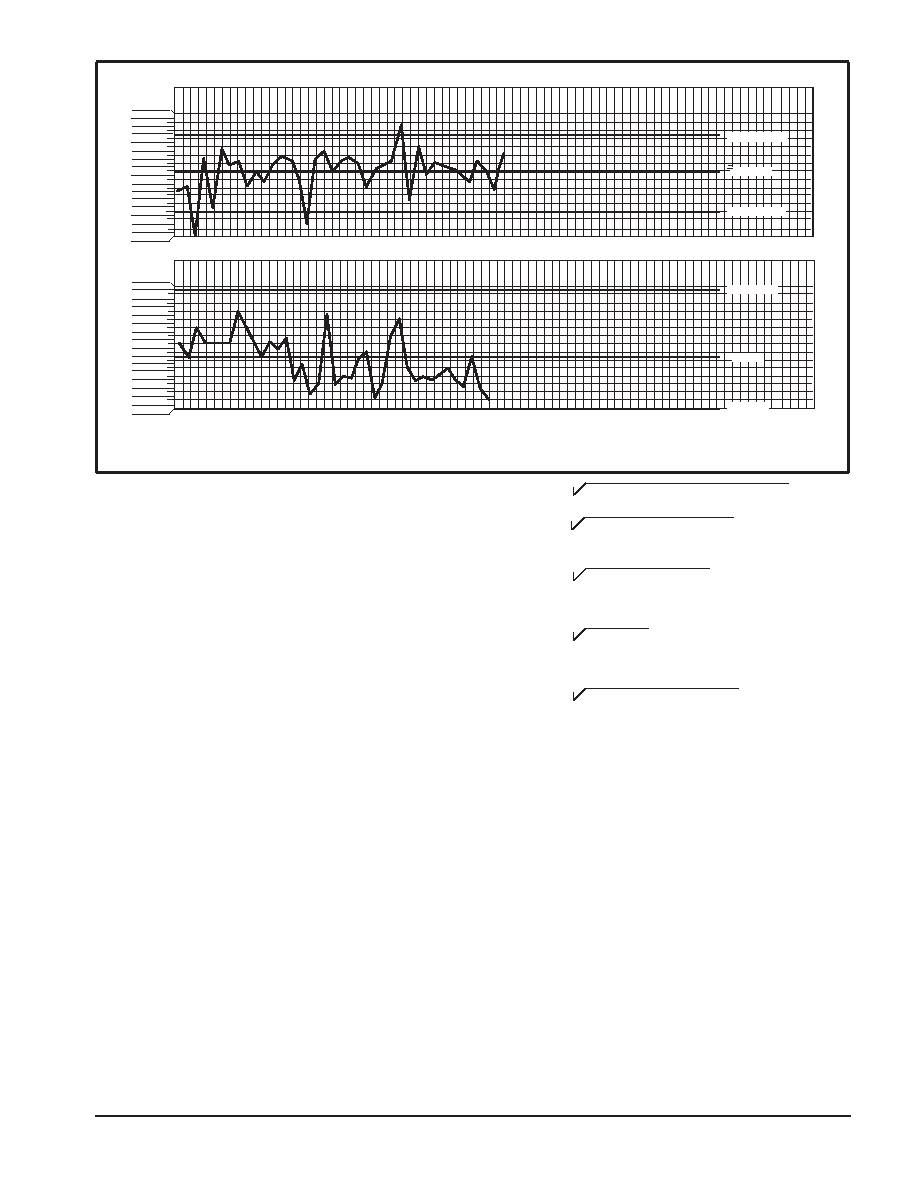
UCL = 152.8
= 150.4
LCL = 148.0
UCL = 7.3
= 3.2
LCL = 0
X
R
Figure 4. Example of Process Control Chart Showing Oven Temperature Data
Where D4, D3, and A2 are constants varying by sample size,
with values for sample sizes from 2 to 10 shown in the
following partial table:
n234
56789
10
D4
3.27
2.57
2.28
2.11
2.00
1.92
1.86
1.82
1.78
D3
*
0.08
0.14
0.18
0.22
A2
1.88
1.02
0.73
0.58
0.48
0.42
0.37
0.34
0.31
*For sample sizes below 7, the LCLR would technically be a negative number;
in those cases there is no lower control limit; this means that for a subgroup size
6, six ‘‘identical’’ measurements would not be unreasonable.
Control charts are used to monitor the variability of critical
process parameters. The R chart shows basic problems with
piece to piece variability related to the process. The X chart can
often identify changes in people, machines, methods, etc. The
source of the variability can be difficult to find and may require
experimental design techniques to identify assignable causes.
Some general rules have been established to help determine
when a process is OUT–OF–CONTROL. Figure 5 shows a
control chart subdivided into zones A, B, and C corresponding
to 3 sigma, 2 sigma, and 1 sigma limits respectively. In Figures
6 through 9 four of the tests that can be used to identify
excessive variability and the presence of assignable causes
are shown. As familiarity with a given process increases, more
subtle tests may be employed successfully.
Once the variability is identified, the cause of the variability
must be determined. Normally, only a few factors have a
significant impact on the total variability of the process. The
importance of correctly identifying these factors is stressed in
the following example. Suppose a process variability depends
on the variance of five factors A, B, C, D, and E. Each has a
variance of 5, 3, 2, 1, and 0.4, respectively.
Since:
σ tot =
σ A2 + σ B2 + σ C2 + σ D2 + σ E2
σ tot =
52 + 32 + 22 + 12 +(0.4)2 = 6.3
If only D is identified and eliminated, then:
σ tot =
52 + 32 + 22 + (0.4)2 = 6.2
This results in less than 2% total variability improvement. If
B, C, and D were eliminated, then:
σ tot =
52 + (0.4)2 = 5.02
This gives a considerably better improvement of 23%. If
only A is identified and reduced from 5 to 2, then:
σ tot =
22 + 32 + 22 + 12 + (0.4)2 = 4.3
Identifying and improving the variability from 5 to 2 yields a
total variability improvement of nearly 40%.
Most techniques may be employed to identify the primary
assignable cause(s). Out–of–control conditions may be
correlated to documented process changes. The product may
be analyzed in detail using best versus worst part comparisons
or Product Analysis Lab equipment. Multi–variance analysis
can be used to determine the family of variation (positional,
critical, or temporal). Lastly, experiments may be run to test
theoretical or factorial analysis. Whatever method is used,
assignable causes must be identified and eliminated in the
most expeditious manner possible.
After assignable causes have been eliminated, new control
limits are calculated to provide a more challenging variablility
criteria for the process. As yields and variability improve, it may
become more difficult to detect improvements because they
become much smaller. When all assignable causes have been
eliminated and the points remain within control limits for 25
groups, the process is said to in a state of control.
相關(guān)PDF資料 |
PDF描述 |
|---|---|
| MMBF170D87Z | 500 mA, 60 V, N-CHANNEL, Si, SMALL SIGNAL, MOSFET, TO-236AB |
| MMBF2201NT3 | 300 mA, 20 V, N-CHANNEL, Si, SMALL SIGNAL, MOSFET |
| MMBF2202PT3 | 300 mA, 20 V, P-CHANNEL, Si, SMALL SIGNAL, MOSFET |
| MMBF5484LT3 | VHF BAND, Si, N-CHANNEL, RF SMALL SIGNAL, JFET, TO-236AB |
| MMBF5486LT1 | UHF BAND, Si, N-CHANNEL, RF SMALL SIGNAL, JFET, TO-236AB |
相關(guān)代理商/技術(shù)參數(shù) |
參數(shù)描述 |
|---|---|
| MMBF102 | 功能描述:射頻JFET晶體管 N-CHANNEL RoHS:否 制造商:NXP Semiconductors 配置:Single 晶體管極性:N-Channel 正向跨導(dǎo) gFS(最大值/最小值): 電阻汲極/源極 RDS(導(dǎo)通): 漏源電壓 VDS:40 V 閘/源截止電壓:5 V 閘/源擊穿電壓:40 V 最大漏極/柵極電壓:40 V 漏極電流(Vgs=0 時(shí)的 Idss):25 mA to 75 mA 漏極連續(xù)電流: 功率耗散:250 mW 最大工作溫度:+ 150 C 安裝風(fēng)格:SMD/SMT 封裝 / 箱體:SOT-23 封裝:Reel |
| MMBF102LT1 | 制造商:Motorola Inc 功能描述: |
| MMBF1374T1 | 制造商:Rochester Electronics LLC 功能描述:- Bulk |
| MMBF170 | 功能描述:MOSFET N-Ch Enhance RoHS:否 制造商:STMicroelectronics 晶體管極性:N-Channel 汲極/源極擊穿電壓:650 V 閘/源擊穿電壓:25 V 漏極連續(xù)電流:130 A 電阻汲極/源極 RDS(導(dǎo)通):0.014 Ohms 配置:Single 最大工作溫度: 安裝風(fēng)格:Through Hole 封裝 / 箱體:Max247 封裝:Tube |
| MMBF170 | 制造商:Fairchild Semiconductor Corporation 功能描述:MOSFET N SOT-23 |
發(fā)布緊急采購,3分鐘左右您將得到回復(fù)。