- 您現(xiàn)在的位置:買賣IC網(wǎng) > PDF目錄358907 > LP2975IMMX-3.3 (NATIONAL SEMICONDUCTOR CORP) Quadruple 2-Input Exclusive-OR Gates 14-SOIC -40 to 85 PDF資料下載
參數(shù)資料
| 型號: | LP2975IMMX-3.3 |
| 廠商: | NATIONAL SEMICONDUCTOR CORP |
| 元件分類: | 模擬信號調(diào)理 |
| 英文描述: | Quadruple 2-Input Exclusive-OR Gates 14-SOIC -40 to 85 |
| 中文描述: | SPECIALTY ANALOG CIRCUIT, PDSO8 |
| 封裝: | MINI, SOP-8 |
| 文件頁數(shù): | 15/19頁 |
| 文件大?。?/td> | 715K |
| 代理商: | LP2975IMMX-3.3 |
Application Hints
(Continued)
that when the total phase shift at 0 dB reaches (or gets close
to) 180, oscillations will result. Therefore, it can be seen
that at least
two poles
in the gain curve are required to
cause instability.
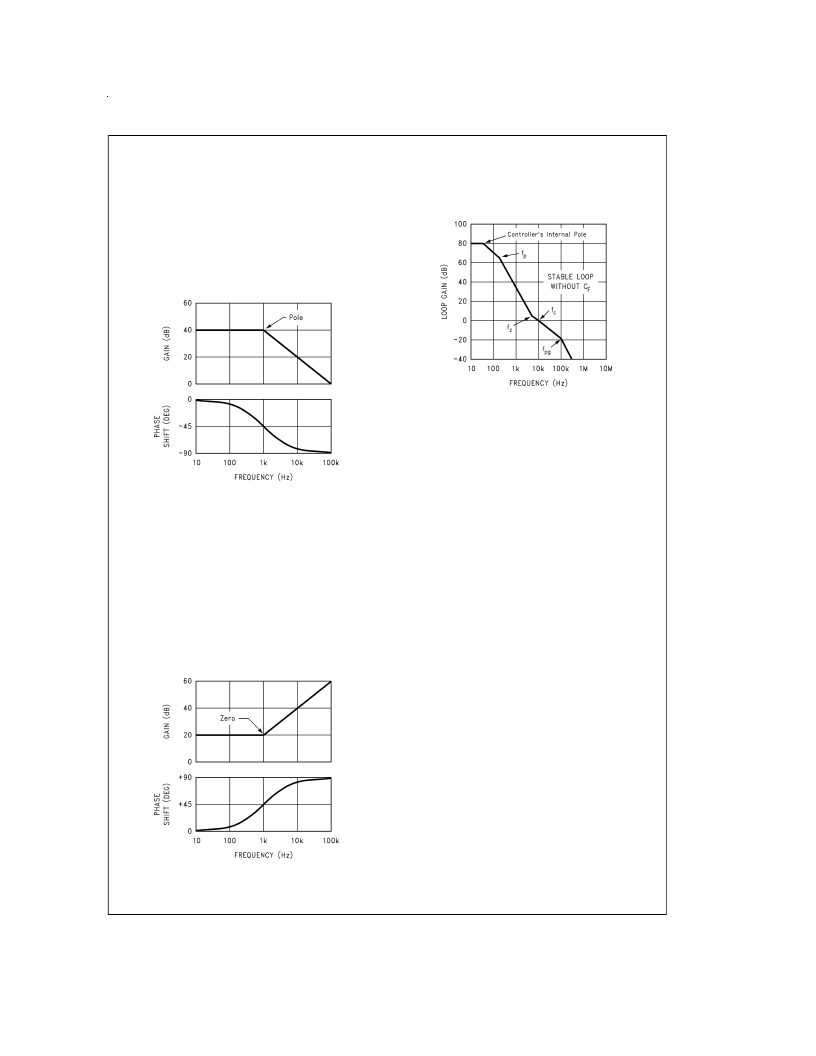
ZERO
:Azero has an effect that is exactly opposite to a pole
A zero will add a maximum +90 of
phase lead
(defined as
positive phase shift
). Also, a zero causes the slope of the
gain curve to
increase
by an additional +20 dB/decade (see
graph EFFECTS OF A SINGLE ZERO).
TOTAL PHASE SHIFT
: The actual test of whether or not a
regulator is stable is the amount of phase shift that is present
when the gain curve crosses the 0 dB axis (the frequency
where this occurs was previously defined as f
c
).
The phase shift at f
can be estimated by looking at all of the
poles and zeroes on the Bode plot and adding up the contri-
butions of phase lag and lead from each one. As shown in
the graphs, most of the phase lag (or lead) contributed by a
pole (or zero) occurs within one decade of the frequency of
the pole (or zero).
In general, a
phase margin
(defined as the difference be-
tween the total phase shift and 180) of at least 20 to 30
is required for a stable loop.
STABILITY ANALYSIS OF TYPICAL APPLICATIONS
The first application to be analyzed is a fixed-output voltage
regulator with no feed-forward capacitor (see graph STABLE
PLOT WITHOUT FEED-FORWARD).
In this example, the value of C
is selected so that the
pole formed by C
and R
L
(previously defined as
f
) is set
at 200 Hz. The ESR of C
is selected so that zero formed
by the ESR and C
(defined as
f
) is set at 5 kHz (these
selections follow the general guidelines stated previously in
this document). Note that the gate capacitance is assumed
to be moderate, with the pole formed by the C
GATE
(defined
as
f
pg
) occurring at 100 kHz.
To estimate the total phase margin, the individual phase shift
contributions of each pole and zero will be calculated assum-
ing f
p
= 200 Hz, f
z
= 5 kHz, f
c
= 10 kHz and f
pg
= 100 kHz:
Controller pole shift = 90
f
p
shift = arctan (10k/200) = 89
f
z
shift = arctan (10k/5k) = +63
f
pg
shift = arctan (10k/100k) = 6
Summing the four numbers, the estimate for the
total phase
shift is 122
, which corresponds to a
phase margin of 58
.
This application is stable, but could be improved by using a
feed-forward capacitor (see next section).
EFFECT OF FEED-FORWARD
: The example previously
used will be continued with the addition of a feed-forward ca-
pacitor C
(see graph IMPROVED PHASE MARGIN WITH
FEED-FORWARD). The zero formed by C
(previously de-
fined as
f
) is set at 10 kHz and the pole formed by C
(pre-
viously defined as
f
pf
) is set at 40 kHz (the 4X ratio of f
pf
/f
zf
corresponds to V
OUT
= 5V).
Effects of a Single Pole
DS100034-25
Effects of a Single Zero
DS100034-26
Stable Plot without Feed-Forward
DS100034-27
www.national.com
15
相關(guān)PDF資料 |
PDF描述 |
|---|---|
| LP2975AIMM-5.0 | MOSFET LDO Driver/Controller |
| LP2975IMM-5.0 | MOSFET LDO Driver/Controller |
| LP2975IMMX-5.0 | MOSFET LDO Driver/Controller |
| LP2975AIMM-12 | MOSFET LDO Driver/Controller |
| LP2975IMM-12 | MOSFET LDO Driver/Controller |
相關(guān)代理商/技術(shù)參數(shù) |
參數(shù)描述 |
|---|---|
| LP2975IMMX-5.0 | 功能描述:低壓差穩(wěn)壓器 - LDO RoHS:否 制造商:Texas Instruments 最大輸入電壓:36 V 輸出電壓:1.4 V to 20.5 V 回動電壓(最大值):307 mV 輸出電流:1 A 負載調(diào)節(jié):0.3 % 輸出端數(shù)量: 輸出類型:Fixed 最大工作溫度:+ 125 C 安裝風格:SMD/SMT 封裝 / 箱體:VQFN-20 |
| LP2975IMMX-5.0/NOPB | 功能描述:低壓差穩(wěn)壓器 - LDO RoHS:否 制造商:Texas Instruments 最大輸入電壓:36 V 輸出電壓:1.4 V to 20.5 V 回動電壓(最大值):307 mV 輸出電流:1 A 負載調(diào)節(jié):0.3 % 輸出端數(shù)量: 輸出類型:Fixed 最大工作溫度:+ 125 C 安裝風格:SMD/SMT 封裝 / 箱體:VQFN-20 |
| LP2978AY-3.8 WAF | 制造商:Texas Instruments 功能描述: |
| LP2978IM5-3.8 | 制造商:Rochester Electronics LLC 功能描述:50MA LDO REGULATOR, LOW-NOISE - Bulk 制造商:Texas Instruments 功能描述: |
| LP2978IM5X-3.8 | 制造商:Rochester Electronics LLC 功能描述:50MA LDO REGULATOR, LOW-NOISE - Bulk 制造商:Texas Instruments 功能描述: |
發(fā)布緊急采購,3分鐘左右您將得到回復。